MSC ODYSSEE Explore 2025.1 is the data visualization, dashboarding, and business intelligence (BI) component of the Hexagon ODYSSEE platform. It is designed to transform complex engineering data—from simulation results, physical test data, manufacturing metrics, and IoT sensor streams—into interactive, real-time dashboards and reports. Unlike traditional CAE post-processors, Explore focuses on cross-disciplinary data aggregation, KPI tracking, and trend analysis at a project or portfolio level. It enables stakeholders to answer business questions like “How is our vehicle’s weight trending?”, “What is the correlation between simulation and test?”, or “Which design alternatives meet our target performance?”.
It serves as the executive “cockpit” for making data-driven decisions based on engineering data, bridging the gap between deep technical analysis and strategic business intelligence.
Primary Users: Engineering Managers, Program Managers, Data Analysts, and Executives who need to monitor, visualize, and gain insights from engineering and simulation data across projects, tests, and operations.
Explore focuses on aggregating and visualizing data from multiple sources to tell a cohesive engineering story.
Interactive Dashboard Builder:
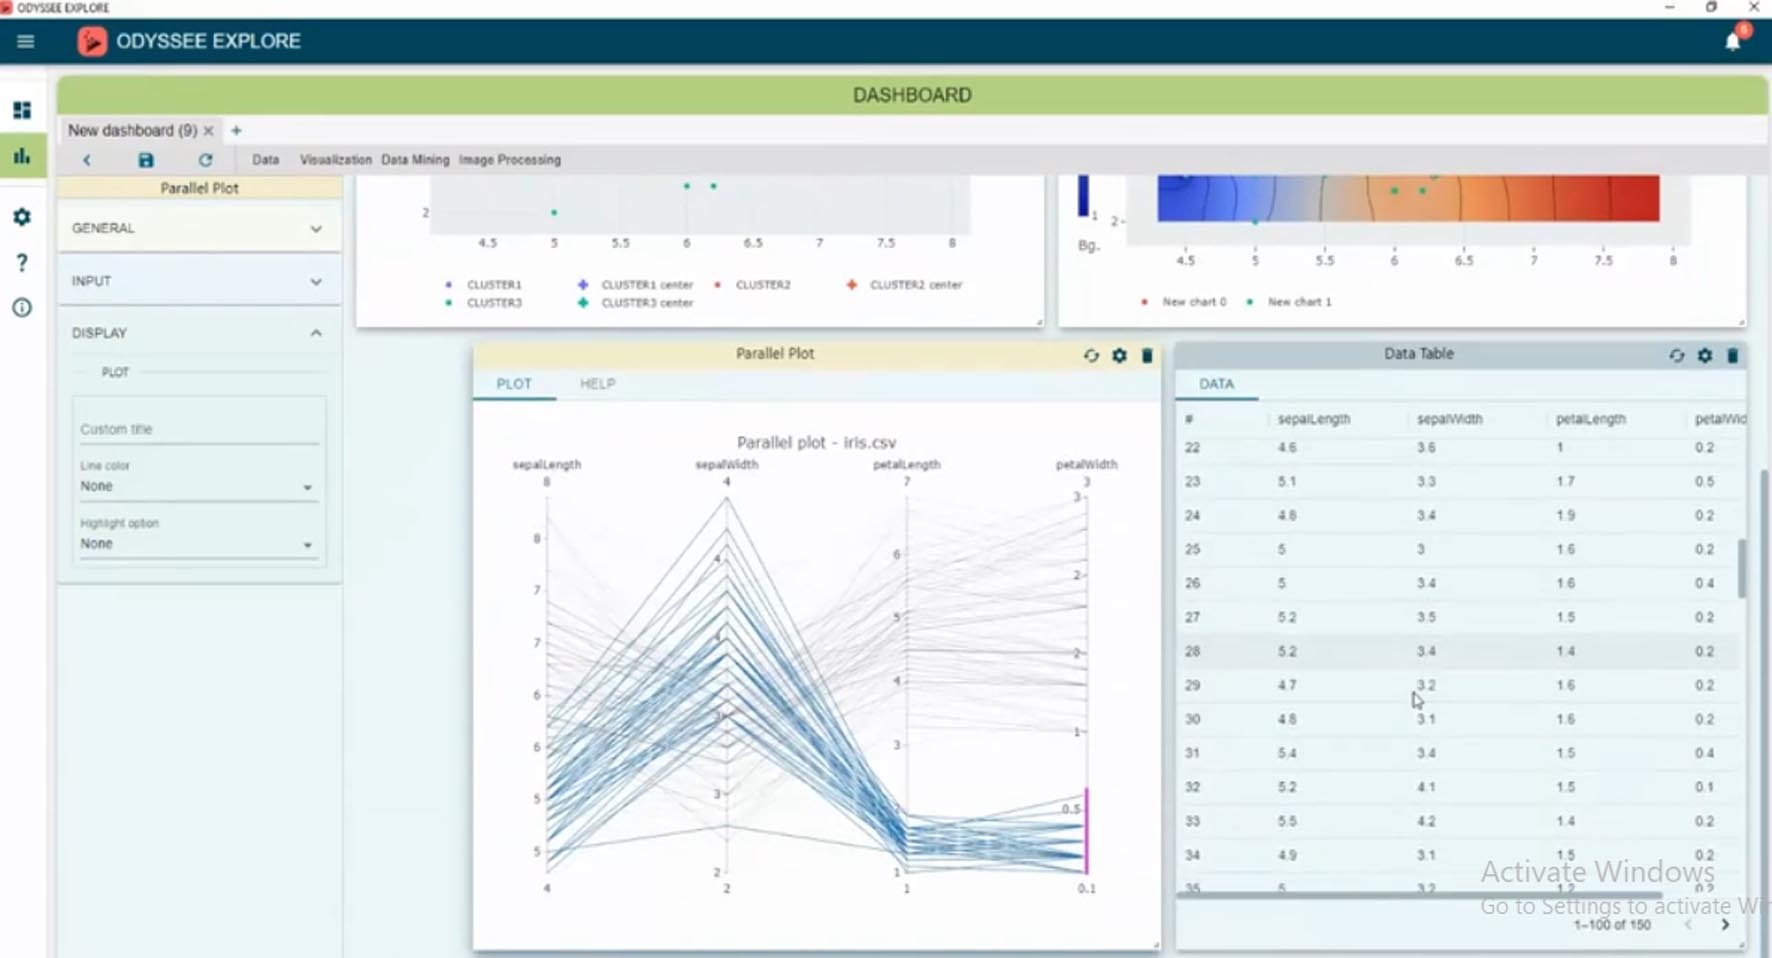
Drag-and-Drop Interface: Create custom dashboards without coding by dragging widgets (charts, tables, 3D viewers, KPIs) onto a canvas.
Library of Visualizations: Includes scatter plots, parallel coordinates, bar charts, histograms, time-series plots, gauges, and geo-maps tailored for engineering data.
Engineering-Specific Visualizations:
3D Model Viewer (Web-based): Embed interactive 3D views of CAD/CAE models directly in dashboards, with the ability to color parts by analysis results (stress, displacement) or other attributes.
Correlation & Spider Charts: Visually compare simulation vs. test data, or compare multiple design alternatives against target requirements.
Design Space Exploration: Visualize multi-parameter optimization or DOE results to understand trade-offs.
Data Connectivity & Aggregation:
Connect to ODYSSEE CAE: Seamlessly visualize simulation data managed within the ODYSSEE CAE SPDM module.
Connect to External Sources: Pull in data from databases (SQL, Oracle), cloud storage (AWS S3, Azure Blob), IoT platforms, test data management systems (TDM), and enterprise PLM via connectors and APIs.
Live Data Feeds: Connect to real-time data streams for monitoring operational assets.
Collaboration & Sharing:
Shared Dashboards & Reports: Publish dashboards to teams or stakeholders with controlled access. Dashboards are live and update as underlying data changes.
Annotations & Discussions: Users can add comments and markups directly on visualizations to collaborate on findings.
Scheduled Reporting: Automate the generation and distribution of PDF or PowerPoint reports.
As a pure web application (SaaS), client-side requirements are minimal and universal.
Client/User Requirements:
A modern, up-to-date web browser (Google Chrome, Microsoft Edge, Mozilla Firefox, Apple Safari).
A stable internet connection.
No specific operating system, CPU, GPU, or local storage requirements. All processing and rendering occur server-side.
Platform/Server Side: Entirely managed by Hexagon on their cloud infrastructure. For private cloud deployments, infrastructure specs are provided by Hexagon.
Price: 325 $
Price Currency: $
Operating System: Windows
Application Category: Mechanical Engineering


Reviews
There are no reviews yet.