
Latest update
License Price
OS
DecisionTools Suite is software for decision management and risk analysis in business and operational projects, developed by Palisade. No matter what industry you work in, this software helps you make confident decisions. Using DecisionTools Suite, you can assess and determine the risk of the project and optimize your decisions. This program has tools for Excel and Microsoft Project and allows you to perform analysis within the spreadsheet.
DecisionTools Suite plays an important role in increasing the quality of decision making in projects and helps teams to think more clearly, act decisively, and make decisions more easily. The software has various tools for simulating the Monte Carlo method, forecasting and statistical analysis, decision trees, predictable neural networks, advanced optimization, and information retrieval and information mapping. You can also use this software for financial and cash flow analysis , multi-step decision modeling, resource optimization, and company risk management.

| DTS-4446 | Convert NeuralTools.XLA to NeuralTools.XLAM for better Antivirus support | NeuralTools |
| DTS-4607 | New Lumivero’s Master License and Service Agreement | Licensing |
| DTS-4457 | Unable to draw graph in Distribution Artist | @RISK |
| DTS-4374 | #REF! error after removing all @RISK functions from SRA Model with Critical Path column before the inputs and outputs columns | SRA |
| DTS-4453 | Files are not removed from Palisade/System folder during uninstall | Installer |
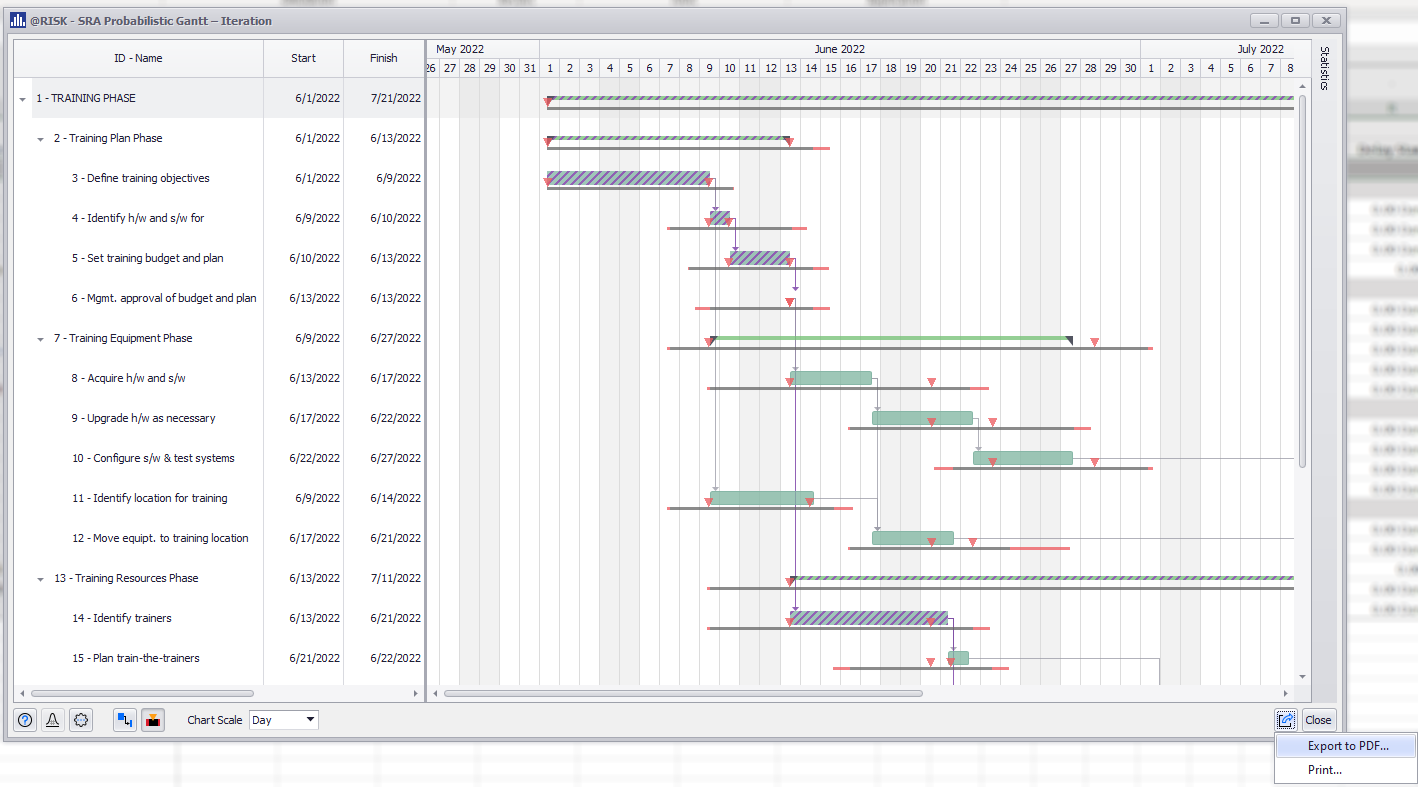
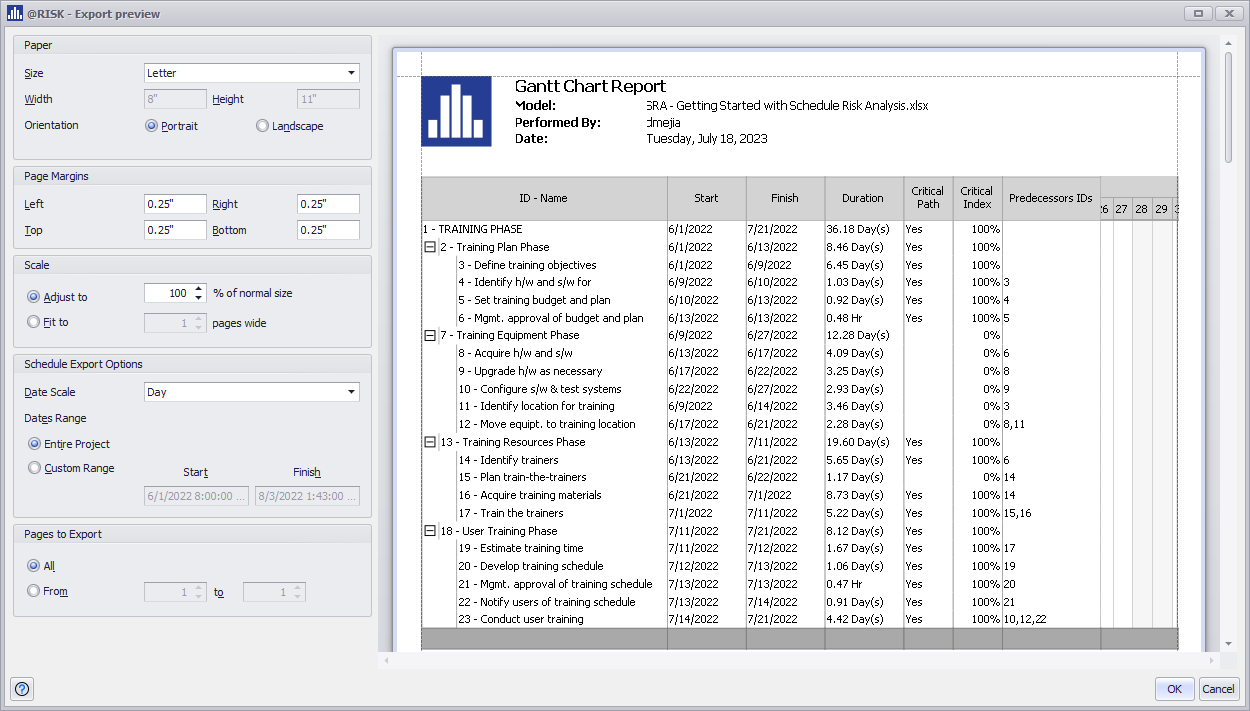
This new feature to export to PDF and print SRA Gantt Charts enables customization of Standard and Probabilistic Gantt Chart exports, including project dates, scales, and industry standards like paper sizes, page margins, orientation, and scale.
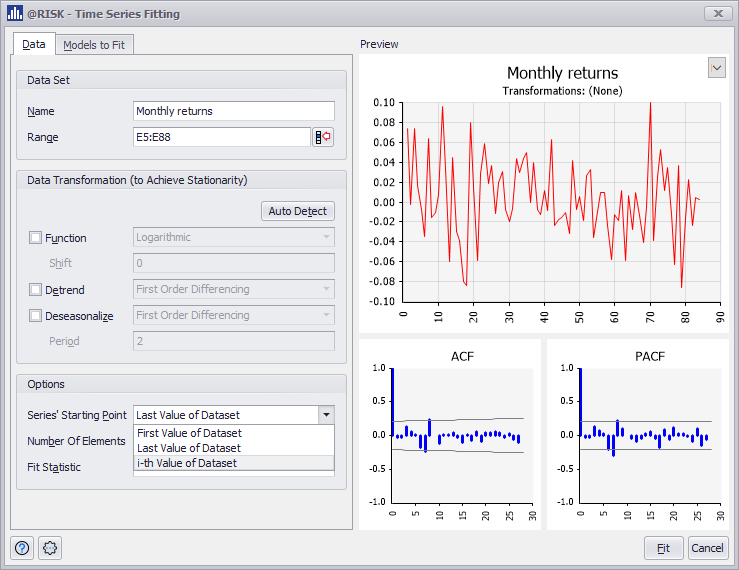
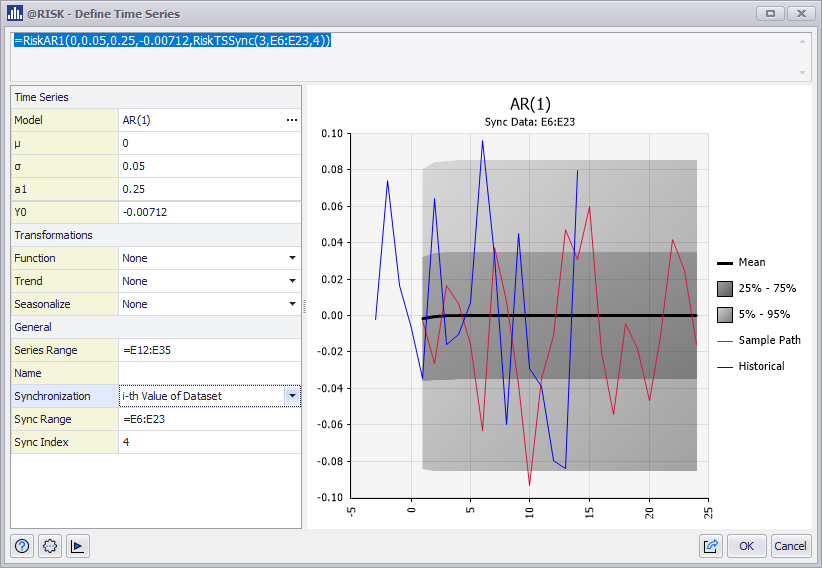
The Time Series Synchronization function now supports synchronizing forecasts to Define and Fit Time Series at any historical data point.
New, improved visualization for Markers in Cumulative Distribution Curves. For graphs with a single cumulative curve, markers are now horizontal by default, pointing precisely to the selected value.
| DTS-3929 | SRA – New feature to Export and Print Deterministic and Probabilistic Gantt Charts | SRA |
| DTS-654 | New option to synchronize Time Series Definition and Fitting at any point of historical data | @RISK |
| DTS-1034 | Display horizontal markers next to Cumulative Distribution curves | @RISK |
| DTS-929 | RiskResultsGraph now supports @RISK models cells that are neither inputs nor outputs | @RISK |
| DTS-4309 | List to select Duration Distributions in SRA Model Worksheet not working with Non-English Regional Settings | SRA |
| DTS-4353 | @RISK crashes when importing a P6 project with out-of-sequence tasks | SRA |
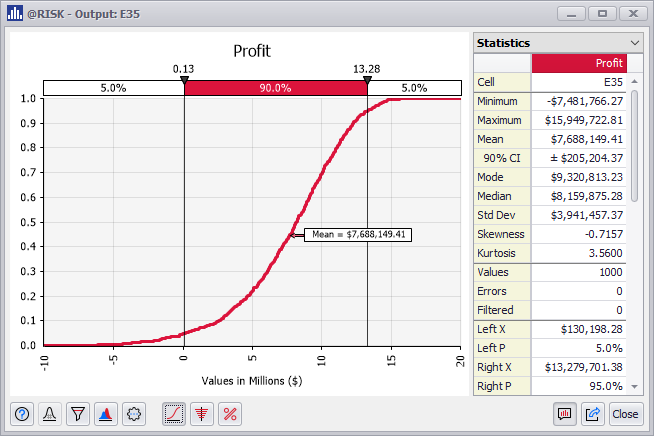
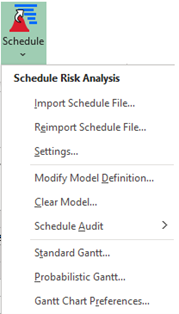
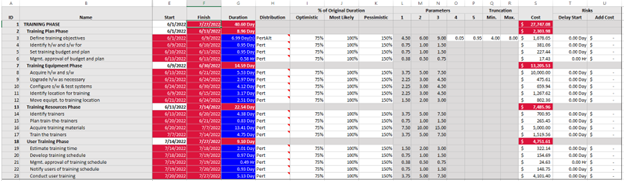
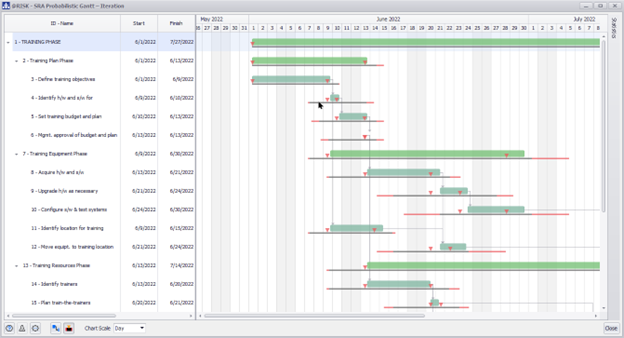
The new @RISK ScheduleRiskAnalysis allows you to define schedule risk models in Excel for project files created in Primavera P6 or Microsoft Project, by applying all the power and flexibility of @RISK Monte Carlo simulation.
The @RISK RISKOptimizer feature has been updated with an improved user interface and experience, and faster optimizations with 64-bit Excel.
The @RISK Stress Analysis feature has been updated with an improved user interface and experience.
Evolver documentation is now online. All Evolver dialogs will now access the corresponding online page.
Please Note: Spanish documentation was partially completed as of the release date. The product will automatically start delivering Spanish documentation content as soon as it becomes available online.
| DTS-482 | New RISKOptimizer User Interface | @RISK |
| New Stress Analysis User Interface | @RISK | |
| DTS-2170 | Support running simulations with @RISK models with correlation matrix and protected workbooks | @RISK |
| DTS-2393 | New Read-Only mode for the Define Distribution Window allows visualizing distribution graphs, statistics, and parameters when the source cell is protected | @RISK |
| DTS-3477 | New ScheduleRiskAnalysis for @RISK | @RISK |
| DTS-2580 | Evolver Online Help Documentation | Evolver |
| DTS-2546 | Support TopRank models with correlation matrix and protected workbooks | TopRank |
| DTS-1983 | Incorrect graph when RiskLock is on a Frequency Distribution for RiskCompound | @RISK |
| DTS-2168 | Unable to create a template report from a protected workbook | @RISK |
| DTS-2169 | Error message when exporting a chart in Excel from a protected workbook | @RISK |
| DTS-2240 | Excel crashes when creating Advanced Sensitivity Analysis Reports when tracking the Standard Deviation | @RISK |
| DTS-2385 | Export report for Data Window has columns mixed between worksheets inputs/outputs | @RISK |
| DTS-2595 | Lognormalt with RiskTruncate2 is giving an error | @RISK |
| DTS-2600 | Improved Error Message when running a Solver model with unknown errors and
@RISK |
@RISK |
| DTS-2608 | Simulation won’t run if a column name in a table starts with the @ character | @RISK |
| DTS-2785 | Cannot open Distribution Artist when active cell is a date | @RISK |
| DTS-2879 | Browse results window only shows one output graph regardless of which output is selected | @RISK |
| DTS-3186 | Fitting Discrete Sample Data: Error Message when scrolling down Statistical Summary | @RISK |
| DTS-3199 | Enable correct available ranking methods in the Fitting dialog for Discrete Sample Data | @RISK |
| DTS-3617 | Advanced Sensitivity Analysis Input Graphs are empty when Output and Input are Dates | @RISK |
| DTS-3641 | Scatter Plots are not shown in the Define Copula Window with Spanish Regional Settings | @RISK |
| DTS-3181 | Suspicious Binary Detected by Antivirus is now whitelisted | DTS |
| DTS-2871 | Evolver progress window doesn’t go away after canceling optimization | Evolver |
| DTS-3028 | Hypothesis Test for Mean/Std. Deviation with Paired-Sample Analysis and Summary Statistics as Input Data returns Runtime Error | StatTools |
| DTS-2551 | Error when opening files with Macros and Concurrent Licenses | Licensing @RISK |
Six new @RISK formulas allow you to create Excel dynamic arrays with @RISK simulation data, results are returned in a dynamic array of whatever size is necessary to hold the values:
This functionality only works on Office 365 with Excel Dynamic arrays.
See these online examples to see how @RISKDataDA and @RISKSensitivityDA can be used to create dynamic Excel Charts:
Dynamic Arrays – RiskDataDA with an LDA Base Model
Dynamic Arrays – RiskSensitivityDA with a New Product Development Base Model
There is a new Error handling functionality that will identify misconfigured or incorrect @RISK elements, including distribution functions, outputs, and @RISK statistic functions.
This release includes the following Error Handling:
Distribution Functions error warnings and explanations are included in the Define Distribution, Model List, and the Results Summary Windows and can be seen by hovering over the icon.
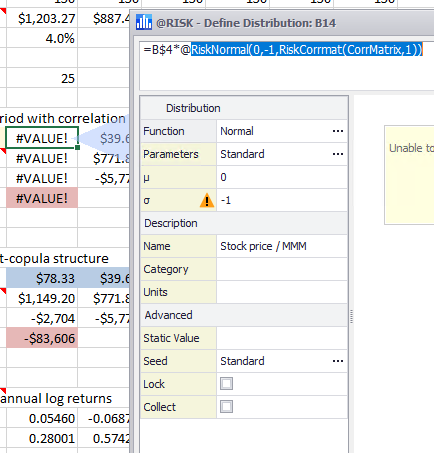
Figure 1 – Distribution Function Error Warning
All @RISK functions with error warnings can be filtered in the Model List and the Results Summary Windows using the new Issue View button (  ).
).
Details of the error from a cell with a Distribution Function can be viewed in the Excel status bar at the bottom of the Excel window.
Output and Statistical Function errors resulting from their precedent distribution functions with errors are included in the Results Summary Windows and can be seen by hovering over the icon.
The Letter Value graph is a new Summary Graph that takes a Box Plot Graph to the next level! It graphs the spread with a variable number of letter value boxes. You will be able to visualize better estimates further out into the tails and reduced number of “outliers” displayed for large data sets.
Figure 2 – Summary Letter Value Graph
See this online example to see how this new graph is used in a Operational Risk model:
Letter Value Graph – Letter Value Graph with an LDA Base Model
The dialog to create Scatter Plot Graphs has been updated to allow selecting inputs and outputs from multiple worksheets.
Figure 3 – Scatter Plot – Select Axis Window
The Define Distribution window now allows for swapping overlay distributions with the original distribution, replacing the original @RISK function with the overlay’s @RISK function. This enables quick comparison of input definitions and quick selection of the distribution that is most appropriate to the model.
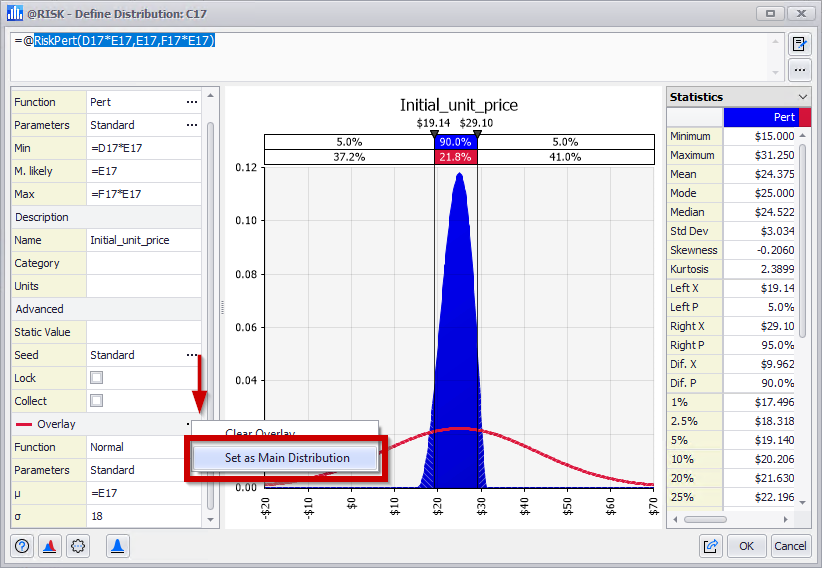
Figure 4 – Define Distribution – Swap Overlay
The Browse Results, Scatter Plot, and Summary Graphs Windows now have the option to Export or Copy the Simulation Data for the displayed inputs or outputs.
The new Simulation Data Report now allows for the selection of inputs and/or outputs to generate a report with their Simulation Data in an Excel Worksheet.
Thumbnail graphs for inputs and outpus are now included in the Data Window, aiding in the interpretation of simulation results.
Two new arguments have been added to the @RISK function RiskSimulationInfo; these will display the Sampling Type and Generator used during the simulation.
The @RISK Advanced Sensitivity Analysis feature has been updated with an improved user interface and experience.
The @RISK License Manager feature has been updated with an improved user interface and experience.
The @RISK Software Update feature has been updated with an improved user interface and experience.
Now when testing or predicting PN/GRN nets there are also warnings for the number of test and prediction cases whose values are not between the minimum and maximum of the corresponding training variables. These warnings can be found in the Preview dialogs, Reports and as a note in the Live Prediction cell for numeric independent variables.
| DTS-1675 | SmartSensitivity Analysis works with Excel LAMBDA functions | DecisionTools Suite |
| DTS-303 | Letter Value Graph added to Summary Graphs group and views | @RISK |
| DTS-392 | Error handling with useful debugging information across the user interface | @RISK |
| DTS-402 | @RISK Dynamic Array Functions | @RISK |
| DTS-483 | New License Manager User Interface | @RISK |
| DTS-485 | New Software Update User Interface | @RISK |
| DTS-644 | Sampling Type and Generator added to RiskSimulationInfo | @RISK |
| DTS-1009 | Export Simulation Data from Graph Windows | @RISK |
| DTS-1032 | Select one of the overlayed distributions to replace the original one | @RISK |
| DTS-1236 | Select inputs/outputs from multiple sheets when creating a Scatter Plot | @RISK |
| DTS-1240 | New Advanced Sensitivity Analysis User Interface | @RISK |
| DTS-1320 | Simulation Data Report | @RISK |
| DTS-374 | Warnings for cases outside the range of training data | NeuralTools |
| DTS-124 | Registry Key is inaccessible if the first run of the product after install is under an Admin Account but subsequent runs are not | @RISK |
| DTS-1470 | RiskSimulationInfo function is showing #N/A when opening a file with simulation data saved in it | @RISK |
| DTS-1628 | Macro file in XLSTART directory prevents multiple CPUs from being used | @RISK |
| DTS-1747 | Adding RiskVary overlay in Define Distribution window doesn’t make use of parameters of underlying distribution | @RISK |
| DTS-1799 | RISKOptimizer models with correlations matrices can cause Excel to crash when running with multiple CPU | @RISK |
| DTS-1957 | RiskCumul showing different results for Standard Deviation between @RISK versions | @RISK |
| DTS-1970 | Models with linked fits crashed on Windows 7 | @RISK |
| DTS-1988 | Saving an @RISK model workbook is not possible after deleting some columns with distributions functions | @RISK |
| DTS-2035 | Excel crashes with multiple CPU simulations | @RISK |
| DTS-2110 | Error when generating a Sensitivity Scatters Report in active workbook | @RISK |
| DTS-2113 | The XDK CreateScenarioReport method crashes Excel | @RISK |
| DTS-1369 | Cancelling prompt during uninstall doesn’t stop the process if there’s a borrowed license | Installer |
| DTS-1704 | Repair option is not working Server Manager | Licensing |
| DTS-1763 | Add missing Spanish example files so they can be accessed from the Examples worksheet | NeuralTools |
| DTS-1832 | Validation error on a non-active tab in Model Settings Dialog doesn’t change tab to highlight error | PrecisionTree |
| DTS-1992 | Error message when defining input ranges in Sensitivity Analysis | PrecisionTree |
| DTS-1715 | TopRank analysis may crash if @RISK also loaded and displaying Browse Results Window |
Price: 0 $
Price Currency: $
Operating System: Windows
Application Category: Risk Management
Latest update
License Price
OS


fatah morghad –
Palisade Decision Tools Suite 8.9.0
product_manager –
Hi
Please contact us via email: info@usoftly.ir