
Latest update
License Price
OS
Available versions: 2024.2.3 , 2023.1.4 , 2021.1.2 , 2020.2.2 , 2019.1 , 17.8.2
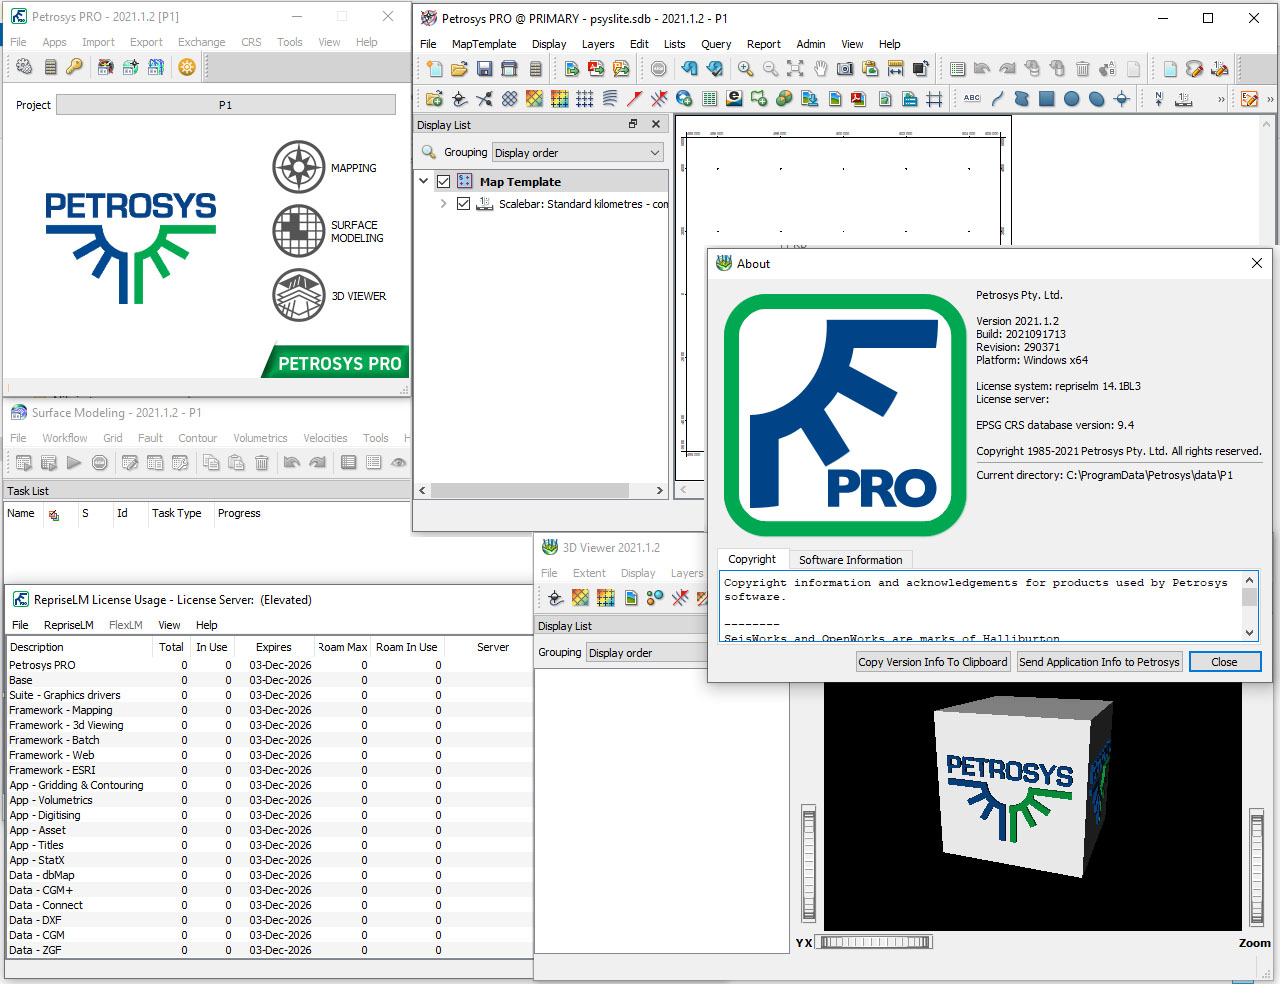
Petrosys is the leader in mapping, modeling and data management solutions for the oil & gas industry – uniquely integrated with the broadest range of specialist geoscience and GIS applications. Petrosys produces quality maps and visualizations. It aggregates, manages and analyzes the underlying data – for actionable results that communicate with clarity and accuracy. Petrosys is the industry leader in mapping, surface modeling and data management software solutions – delivering direct connectivity with the E&P industry’s most popular exploration, production and GIS data sources. Petrosys produces high quality maps and surface models. It manages, edits, and analyses the underlying information including the specialised seismic, well and geoscience data used in the search for oil and gas. Geoscientists, data managers and engineers at more than 300 sites worldwide use Petrosys software as an essential tool for basin and field interpretation, to enhance enterprise data management and to help make better decisions.
| Petrosys PRO 2023.1.4 takes visualization to the next level with a completely new X Section module and a Fault Statistics module.
Building on the strong collection of innovative and improved features in the PRO 2021 series across Connectivity, Mapping & Visualisation and Surface Modeling, Petrosys PRO 2023.1.4 delivers the latest functionality whilst the enhanced development of existing features continues to add value to our client’s software investment. Highlights X Section application: the next step in advanced visualisation making it easier for you to understand the relationships in your structure and achieve an accurate representation of the subsurface. · Fast and Easy: Create a line of section from an existing Petrosys PRO map. · More Powerful than Ever: View surfaces in the cross section before & after editing and re-gridding. · All your Data in One Place: Display data from 3rd party vendors and compare in cross section. Fault Statistics: development driven by customer feedback the new tool gives users access to plotting capabilities, thematic mapping, editing functionality, rose diagrams and much more. Licensing updates: · PRO 2023.1 requires a new license file to be installed for all clients Supported Environment updates of note: · Linux platforms RHEL7 and RHEL8 are supported, RHEL6 is no longer supported. · Windows 10 is the minimum supported version for Windows. |
Highlight features introduced in 2023.1X SectionA completely new application for generating cross sections. Pick a single line, well traverse multi point traverse or single well section. Create in Mapping or the new X Section application. Well display, horizons, faults and GIS data can be displayed in the section. The layout properties are customisable to suit each section created. Features: • New module for a standalone (top level window) X Section application, targeting structural cross sections, accessed from main Petrosys menu or from within Mapping (populated from current Map display). • Tied to 3D viewer licensing • Standard display list functionality – layer ordering and grouping, visibility, undo/redo, copy/paste, drag and drop. • Different methods to define line of section: single line segment, multiple line segments, well traverse (SH, BH or marker), well directional survey. Interactive editing in plan-view where applicable. • Horizon flattening – Choose one horizon and adjust relative so horizon appears flat. Deals with pinch-outs • Display of multiple surfaces/grids, wells, fault surfaces, and cultural information. • Full control over annotation, colors, lines etc., including the ability to color fill between surfaces/horizons. • Simple interactive correction of ambiguous zones • Presentation map elements – title block, legend, location map, text annotation, image/picture display • Reading and displaying of log data read from all supported Well Log sources (Petrel, OW, Paradigm, Kingdom, DUG, IC (ODM), dbMap) • Shared cursor tracking between X Section, Map and 3D Viewer • Maps to be drawn in cross section as an inset and cross section images to be drawn on Map • Standard output and export options (hardcopy, pdf, pptx, raster image, SVG).
Drag and DropDrag and drop supported data from your interpretation package onto the X Section. Multiple data sources are supported in the one section. WellsWell paths can be displayed with annotations for well name, tops and more. Well LogsWireline logs for wells can be displayed as part of the well display. Horizons With ColorFillZones can be created either manually or automatically from the surfaces selected for display. Automatic assigned colorfill or manual color selection is also available. FaultsFault surfaces from the interpretation packages can be displayed on the section with full control over display options. FlatteningSurfaces can be chosen to be flattened, the thickness to other surfaces is honoured allowing the interrogation of surfaces at potential times of peak hydrocarbon migration to assist in structural prospect identification. |
Shared CursorWhen X section is linked to mapping and/or 3D Viewer the mouse cursor can be seen in all three windows to view the relationships in 3D, plan and section views. Auto Populate ZonesWhen displaying and generating zones between surfaces, zones can be generated by the click of a button to save time. Zones are still able to be created, modified and deleted as necessary. Style ControlBackground color, annotation, grid and tick marks can be added, modified and customized to suit the X Section requirements. Manual Scroll and Rotation of LineIn the Map window the line of section can be moved, rotated and re-picked to show a section over a different line of section with the existing section properties, saving time creating new sections. Display GISGIS data can be displayed where location and depth data is included in the datafile. Multiple GIS data sources and types are supported. Link to 3D ViewerThe supported data displayed in the X Section can be displayed in 3D viewer with the click of an icon. Fault StatisticsThe launch of Petrosys PRO 2023.1 delivers into the hands of our users exactly what they asked for in a Fault Statistics tool. · Plotting Capabilities: Visualise the throw-length profiles and cross plots of fault statistics. · Thematic Mapping: Show distribution of the throw gradient across the length of each fault, useful for identifying high slip zones & fault QC. · Editing Functionality: Directly edit the throw profiles and feed those edits back into the fault polygon data set or use in conjunction with the spatial editor. Throw Profiles · Extract information on the maximum throw, fault length, azimuth and strike for a fault dataset · Assess the validity of a subsurface map through the assessment of a single or multiple faults e.g. validate your trap.
Thematically Map Fault Attributes
Data Editing · Carry out edits directly in the throw-length plot to adjust the amount of throw interpreted along a fault · Edits are fed back into the fault file · Use in conjunction with the Spatial Editor.
Cross Plotting
Rose Diagrams The strike count rose diagram is a visual representation of the distribution of fault strikes, each section representing a different area of the target. The number of fault strikes that occurred in each section is indicated by the length of a “petal” extending from the center of the circle. The direction of the petal indicates the direction of the targeted area. The longer the petal, the higher the strike count in that particular section. Data Required Fault statistics works with:
• Support for Petrel, Kingdom
Data Export Export Data to
|
Notes for Upgraders and Installers of ApplicationsUpgraders from Petrosys PRO 2021 or earlier should be aware of the following changes: · Petrosys PRO supports Red Hat Enterprise Linux 7 and 8 (RHEL7, RHEL8) and equivalents (CentOS, AlmaLinux, RockyLinux, Oracle Linux). · Petrosys PRO 2023.1 requires a new license file for every client. Please obtain your license file by logging on to the Petrosys Client Portal or contacting Petrosys Support. |
Price: 0 $
Price Currency: $
Operating System: Windows
Application Category: Oil & Gas Engineering
Latest update
License Price
OS


Reviews
There are no reviews yet.